Uncover Insights at the House-hold level
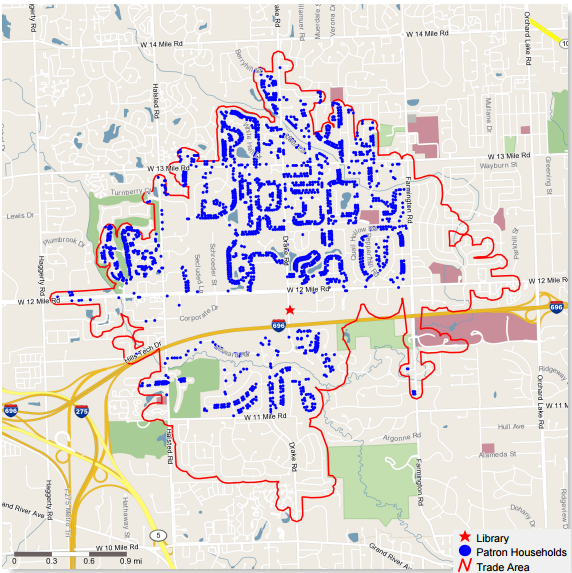
As change happens, you can better understand and visualise your community's current library activity aligned to demographics like location, household composition, length of residency, and more. Access eye-opening insights from reports like these:
- Demographic Overview—Change happens over time. See your community's current library activity aligned with demographics like population, age, race/ethnicity, income, and lifestyles by household
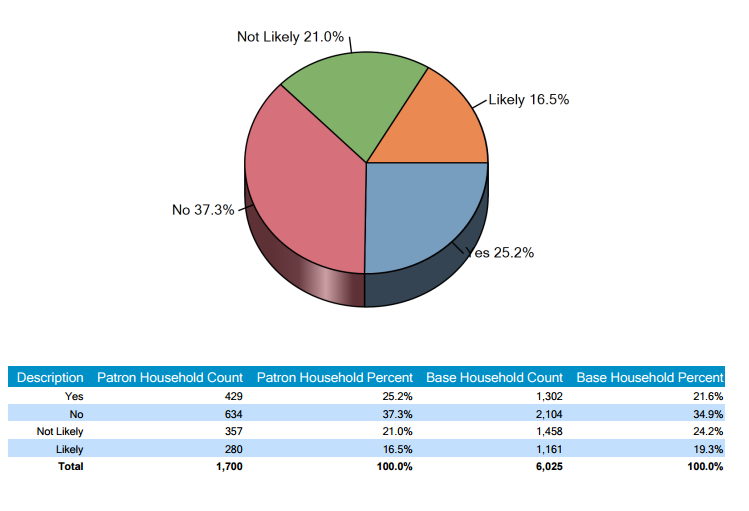
- Patron Analysis Demographics—View library activity based on location, household composition, length of residency, behaviors, and interests
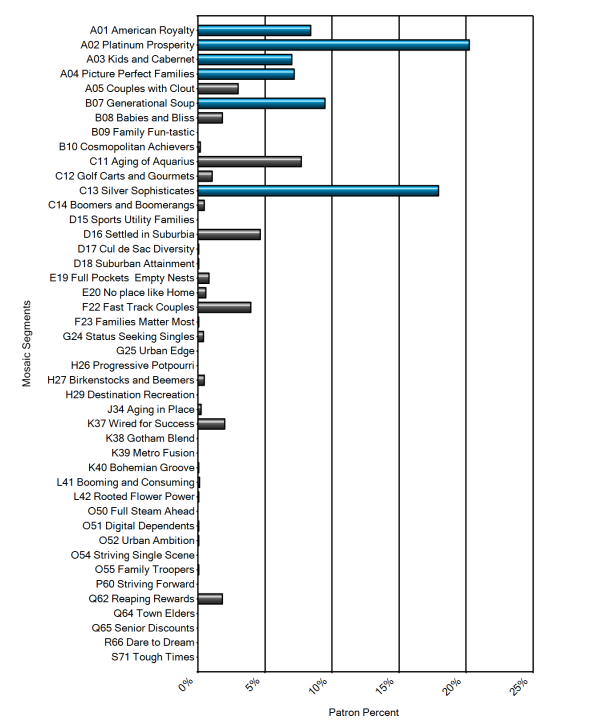
- Mosaic Profiles—Learn who your users are and find more like them using this well-known household-based segmentation system from Experian, which classifies all Australian households and neighborhoods in unique Mosaic types groupings
Actionable insights from Gale Analytics On Demand will lead to better outcomes:
- Understanding patrons—Embrace a human-centric approach with real household data from your community
- Administrative decision making—Provide services and allocate resources to increase your library's impact on diverse user groups and populations
- Strategic planning—Gain continuous access to usable data that allows libraries to adapt and modify plans based on discoveries throughout the process
- Performance measurement—Refresh data as often as needed to determine the impact of your data-driven decisions.
Look Inside
Platform Features & Tools
Mosaic® Lifestyle Segmentation
Understand patron data with household-based segmentation from Experian, which classifies all U.S. household neighborhoods into 71 unique profiles.
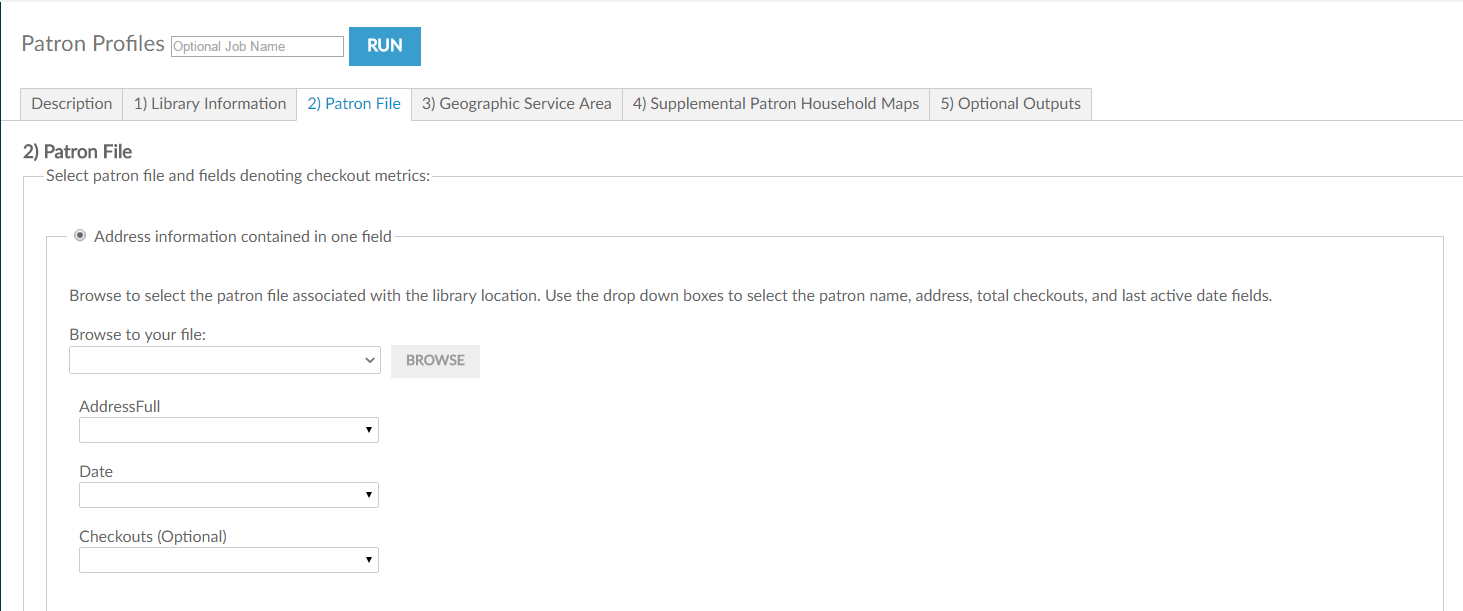
On-Demand Reporting
Make your data visual with charts, maps, and graphs on customized reports available in PDF, Excel, and other formats.
Bonus Marketing Apps
With the purchase of any Analytics On Demand app, you have access to several free apps, including Twitter Tracker, Word Cloud Generator, and profiling for Google AdWords.


