Visualize your community’s current library activity and better meet their needs.
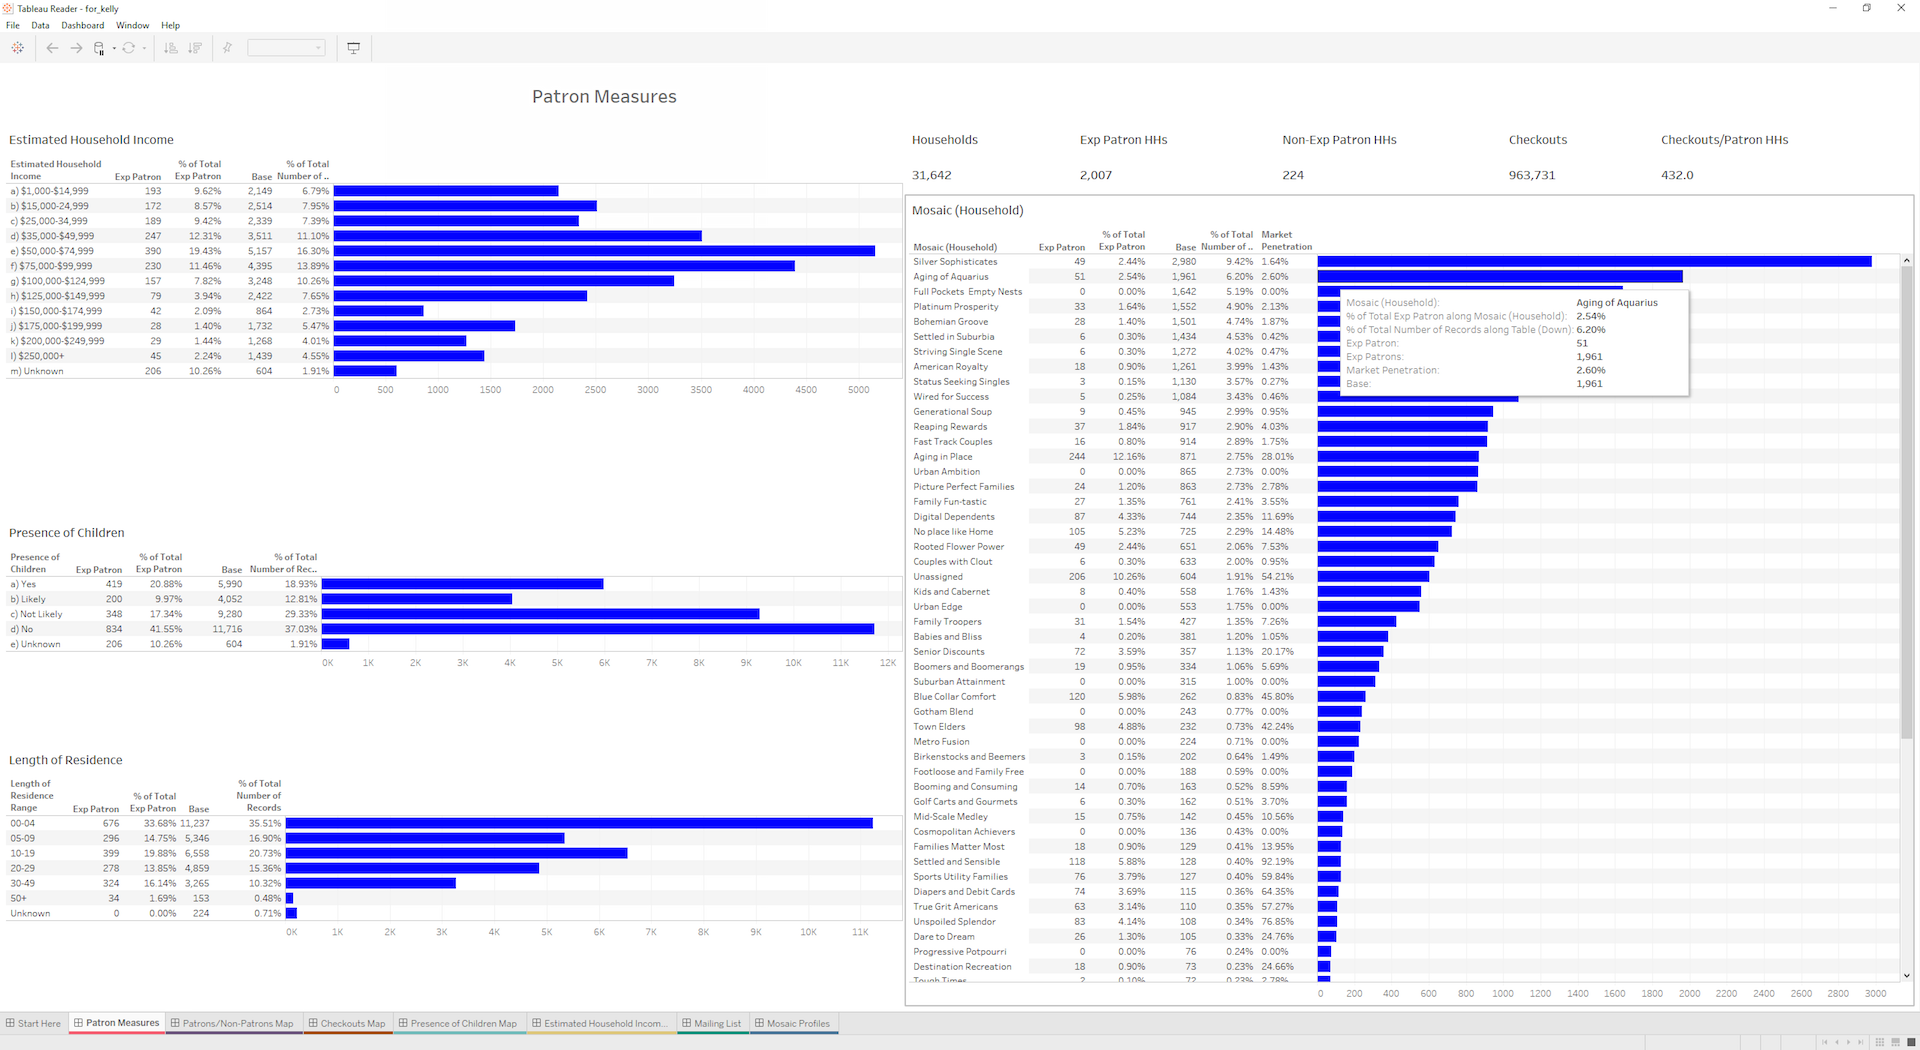
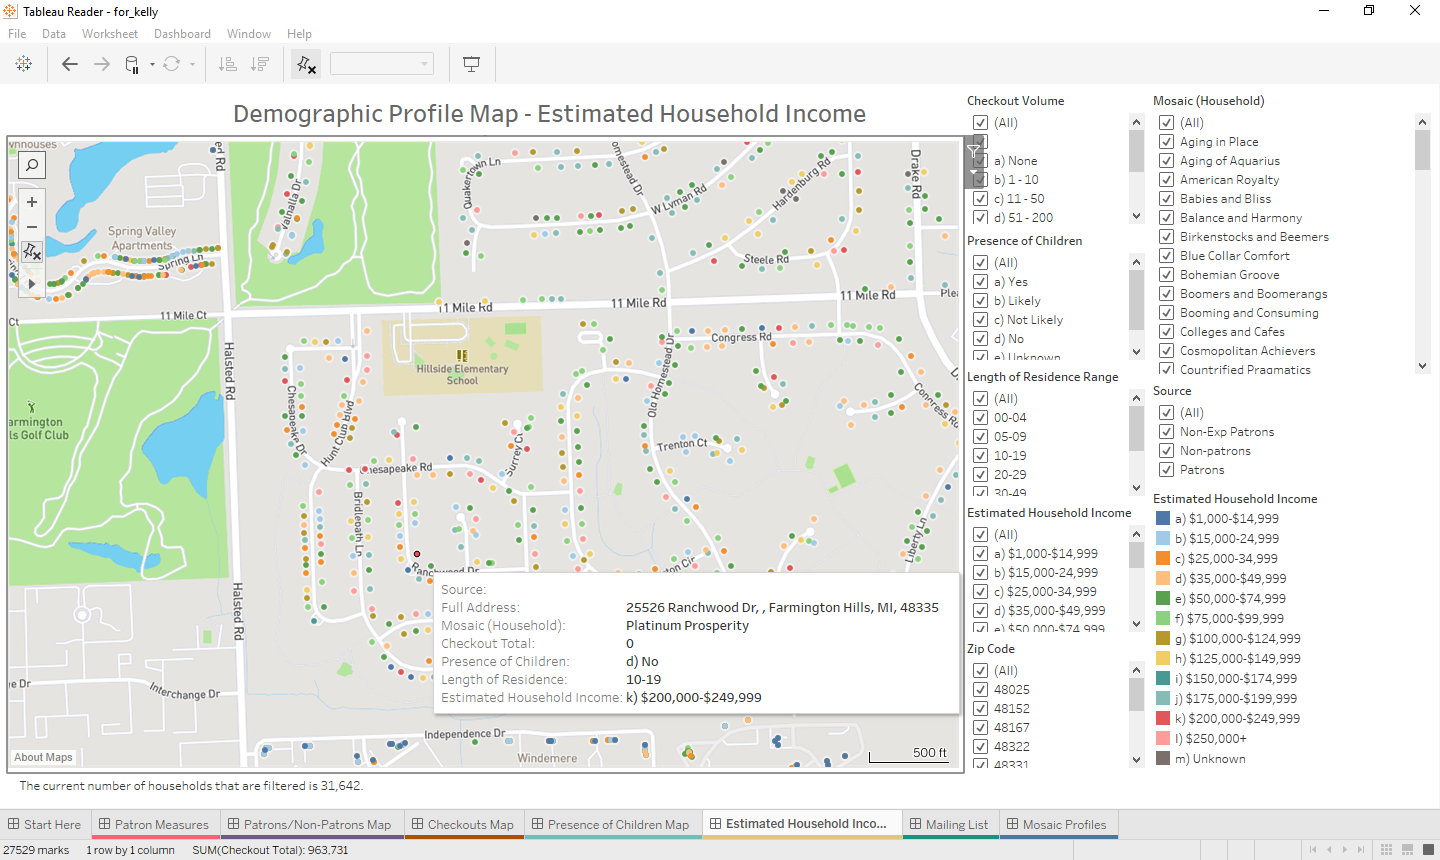
Segment households in your library’s service area (patrons and nonpatrons) based on interest, income, presence of children, and more. As change happens over time, your library can better understand and visualize your community’s current library activity, and see how to effectively meet its needs.
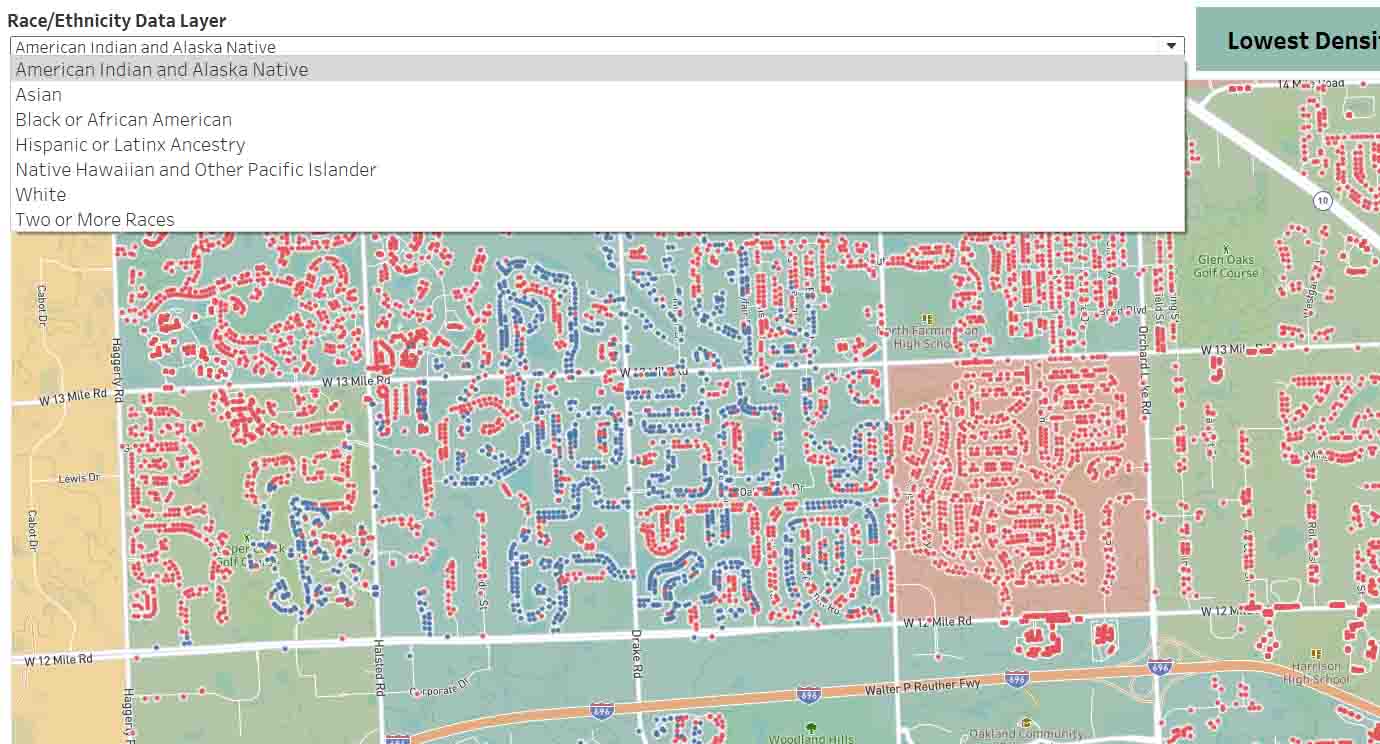
For those focused on equity of access in their communities, users have the ability to understand their demographic reach by combining a census map of race/ethnicity by tract with variables such as education level, household income, and checkout volume.
Gale Analytics effortlessly merges your library’s integrated library system (ILS) data with Mosaic® segmentation from Experian and other datasets. Using dashboards in Tableau Reader, users can segment households based on demographic and lifestyle criteria—drilling down into rich visuals, dynamic maps, and downloadable custom mailing lists based on segmentation.
Look Inside
Platform Features & Tools
Mosaic Lifestyle Segmentation
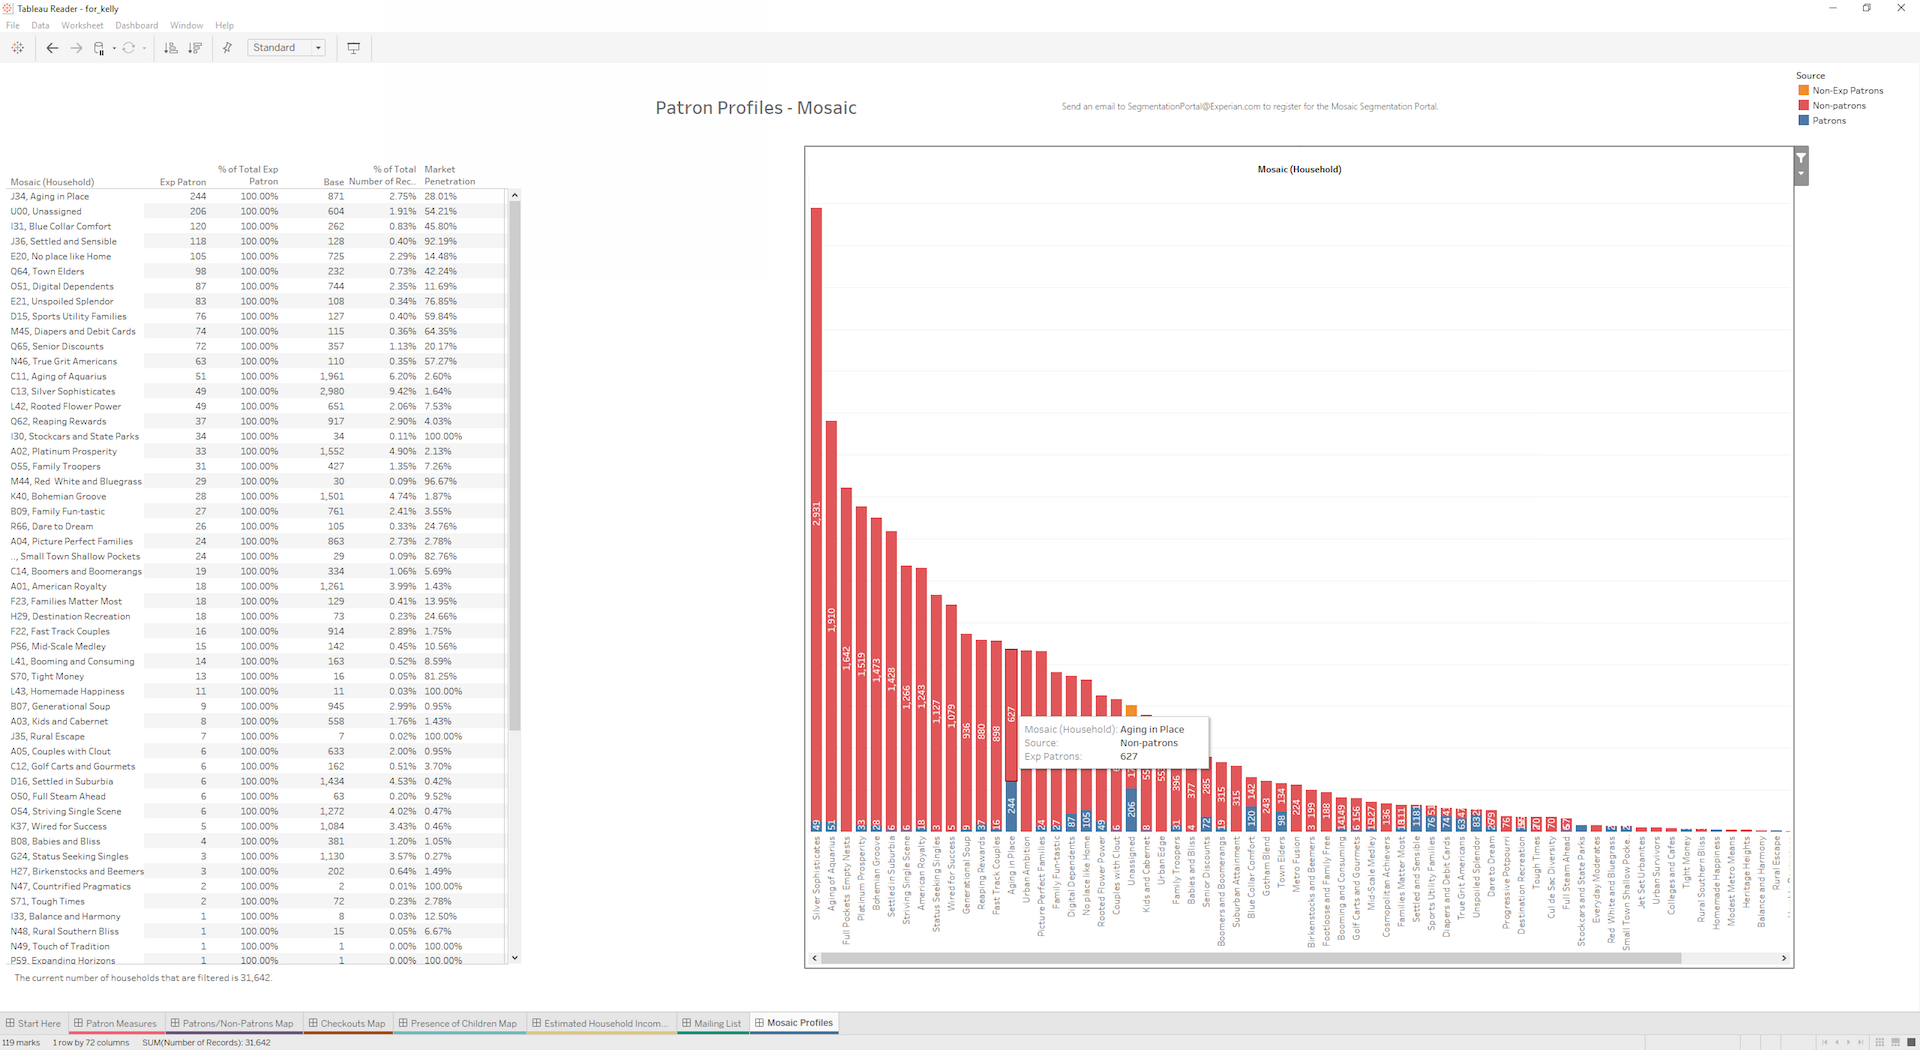
Understand patrons using household-based segmentation from Experian, which classifies all U.S. household neighborhoods into 71 unique profiles called Mosaic segments.
On Demand Reporting
Customize your dashboard by modifying the service area, selecting cities and counties, or uploading a GIS spatial file. You can export dashboard visuals as PDF, PowerPoint, or PNG files.
Ensure Patron Privacy
Designed to protect the privacy of individuals, addresses and circulation data are disassociated from customer names. All data research is blended in a secure cloud environment, and output goes directly back to the library account.


