In The News
Analyzing Library Communities
From the popular library tech magazine, Online Searcher, writer Barbie E. Keiser reviews how libraries are planning for the future by analyzing their communities using tools like Gale Analytics.

Ensure that your marketing goals and objectives support households across the area you serve. By integrating powerful demographics, Gale Analytics adds value to existing data—including content from your integrated library system (ILS) and other electronic systems—unlocking key insights about your community to fuel your marketing outreach. Easy to use and share, Tableau Reader dashboards better equip your library and staff to target new populations, create new programs, market library services, and allocate resources more efficiently.
Gale Analytics uses the power of Experian’s Mosaic® USA proprietary household segmentation system to make it easier for librarians to understand their surrounding population. Experian segments households into 71 unique profiles, or Mosaics, which are used to help librarians segment patrons and nonpatrons based on demographic and lifestyle characteristics. Librarians can also skip some time and the stress of preparing data with help from Alteryx workflows, which provide a reusable workflow for self-service data prep and statistical analysis, allowing more time to analyze data. With an easy way to prepare, blend, and visualize data sources, Gale Analytics helps you extract maximum value from your data to better inform your outreach.
Our dashboards effortlessly merge your library’s ILS data with Mosaic segmentation from Experian and other data sources to evolve the way you do business and to help librarians and staff make more informed decisions that drive your marketing plan. With the free version of Tableau, Tableau Reader, librarians and other users can segment households based on interest, income, technology use, presence of children, and more—drilling down into rich visuals, dynamic maps, and downloadable custom mailing lists based on segmentation for maximized outreach.
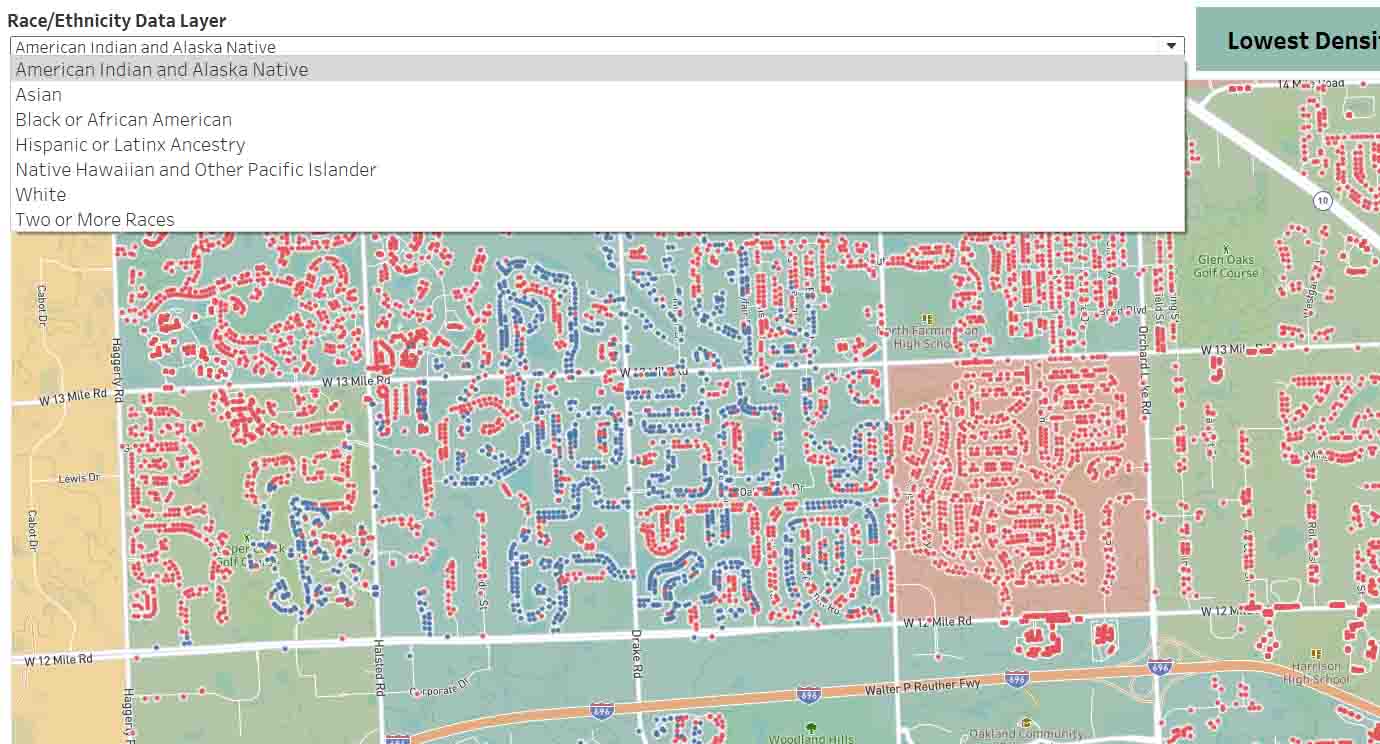
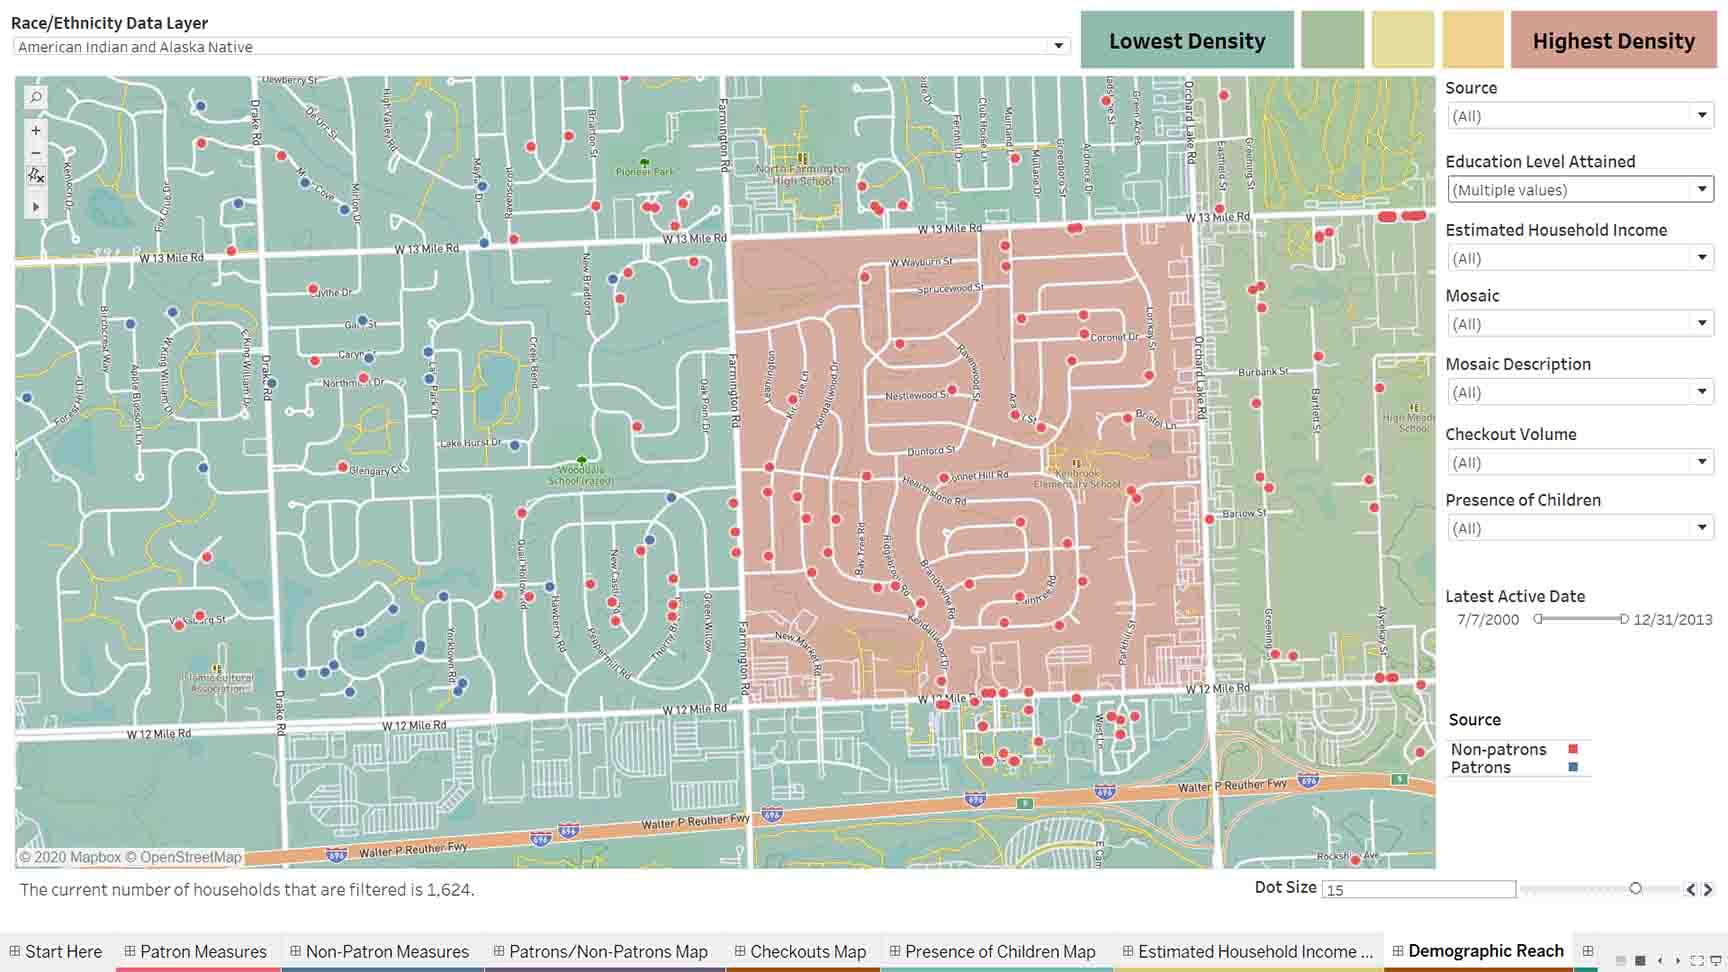
For libraries focused on equity of access in their communities, Gale Analytics: Community Insights and Patron Insights now offer users the ability to understand their demographic reach by combining a census map of race/ethnicity by tract with variables such as education level, household income, and checkout volume. Read More >>


The interactive dashboards allow librarians to tap into the needs and interests of their surrounding population by merging existing data with comprehensive demographic insight and metrics to better inform planning, programming, collections, outreach, and other library marketing efforts.


Gale Analytics was named a 2021 EdTech Cool Tool Award Finalist in the Best Learning Analytics/Data Mining Solution category.

Gale Analytics was named a 2021 CODiE Awards Finalist in the Best Big Data Reporting & Analytics Solution category.
Send the dashboard file to your colleagues. Everyone can benefit from the dashboard interactively after downloading Tableau Reader. Users can also export visuals as PDF, PowerPoint, or PNG files.
Leverage Mosaic® segmentation from Experian and Alteryx workflows to segment your audience based on interests.
Fuel your marketing by downloading segmented mailing lists to promote your main content offerings, programs, materials, and more.
Drill down into rich visuals, dynamic maps, and downloadable custom mailing lists based on segmentation.
Use the dashboard on an ongoing basis for strategic planning and day-to-day operations to directly show how your library impacts the community.
Designed to protect the privacy of individuals, addresses and circulation data are disassociated from customer names. All data research is blended in a secure cloud environment, and output goes directly back to the library account.
Discover how Lake County Public Library used Gale Analytics to target audiences for their Dolly Parton Imagination book-gifting program to maximize their outreach.
Data, backed by librarian intuition, has given Spokane Public Library the confidence to tailor programming to the needs of each branch and continue services that people are most drawn to by region.